Insight
Beginner’s guide to website analytics
How to use your data to make smarter, more confident decisions.

Website analytics is the process of collecting, processing and interpreting data about how people use your website. Most modern analytics tools make it very easy to collect raw data: page views, clicks, locations, devices and so on. However, in its raw form, this data has very little value.
The real value of analytics comes from what you do with that data. You can interpret the raw data to uncover actionable insights that align with your business objectives. It helps you understand where you are now, where you want to be and what is stopping you from getting there.
Instead of relying on guesswork, instinct or top-down opinions, analytics allows you to make decisions based on clear evidence. You can then update your website, content and digital strategy with confidence, knowing changes are grounded in real user behavior.
A helpful way to visualize analytics is as a four step process:
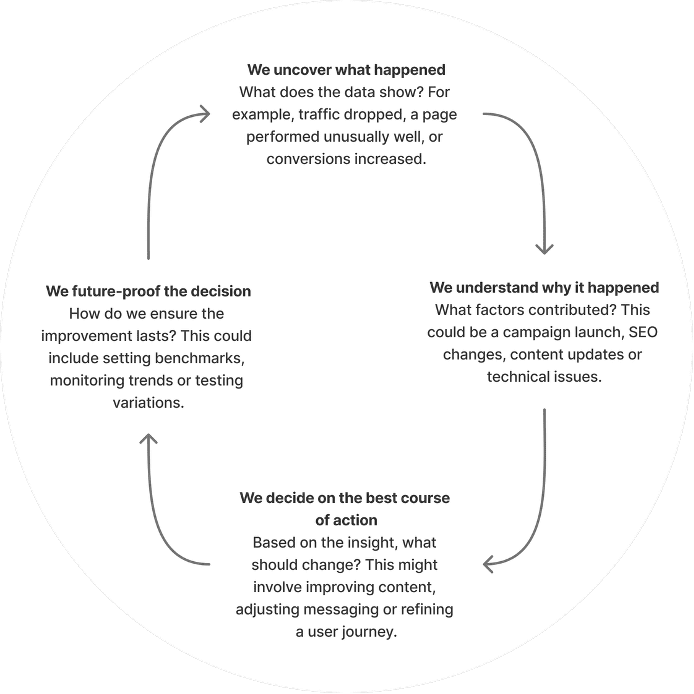
At its simplest, analytics is a continuous feedback loop: measure, learn, improve, repeat.
How businesses use data to improve strategy
When used well, website analytics can support decision making across marketing, content, UX and even wider business strategy. For example:
- Improving conversion rates: if data shows users frequently visit a service page but rarely complete a contact form, this may indicate unclear messaging, poor page structure or friction in the form itself.
- Refining content strategy: analytics can highlight which pages or topics perform best, helping teams focus on content that genuinely resonates with their audience.
- Optimizing marketing spend: understanding where traffic comes from helps businesses invest more in channels that deliver results.
- Enhancing user experience: drop off points in key journeys can reveal usability issues, confusing navigation or mismatched user expectations.
- Supporting business growth: insights into audience location, device usage or returning visitors can inform decisions about expansion, localization or product development.
At its simplest, analytics is a continuous feedback loop: measure, learn, improve, repeat.
What website analytics tools are available?
There are many website analytics platforms available on the market. However, the two most prominent and widely adopted solutions are Google Analytics 4 (GA4) and Adobe Analytics. Each offers different strengths depending on business size, complexity and analytical needs.
1) Google Analytics 4 (GA4)
Google Analytics is the most widely used analytics platform and is often the default choice for small to medium sized businesses.
What’s included:
• Event based tracking (page views, clicks, scrolls, downloads)
• Traffic source and channel reporting
• Audience insights (location, device, returning vs new users)
• Conversion tracking
• Custom exploration reports
• Integration with Google Ads, Search Console and other Google tools
What’s not included:
• Advanced out of the box visualization (compared to enterprise tools)
• Native heatmaps or session recordings
• Deep custom attribution without configuration
You can follow this GA4 setup guide to get started.
2) Adobe Analytics
Adobe Analytics is an enterprise level analytics platform designed for large organizations with complex data needs.
What’s included:
• Highly customizable reporting and segmentation
• Cross-channel customer journeys
• Deep integration with Adobe Experience Cloud
• Real time data processing
What’s not included:
• Simple or quick setup
• Cost effective pricing for smaller teams
• Beginner friendly interfaces
Adobe Analytics overview and setup.
Before you start analyzing your data
Once your website analytics account is set up, data collection begins automatically. Before diving into reports and dashboards, it’s important to step back and define what good looks like for your website.
While data is being collected, consider the following questions:
- What are your conversion points?
What actions indicate success for your business? This could include contact form submissions, brochure downloads, newsletter sign ups or other meaningful interactions. - Which pages matter most to your business goals?
Identify the pages that play a critical role in driving enquiries, educating users or supporting decision making. - How do users find your website?
Consider the different entry points (organic search, paid campaigns, social media or referrals) and which pages you ideally want users to land on from each source. - What is your ideal user journey?
Think about the path you expect users to take through the site, from first visit through to conversion.
Once enough data has been collected, you can begin mapping real user behavior against these goals. This comparison helps highlight gaps, opportunities and areas for optimization across content, structure and messaging.
Before diving into reports and dashboards, it’s important to step back and define what good looks like for your website.
Getting your analytics working for you
Setting up analytics is only the starting point. The real value comes from using data to validate assumptions, guide decisions and continuously improve your website.
By clearly defining your goals upfront and then reviewing performance against them, analytics becomes a practical decision making tool rather than a passive reporting exercise.
Regularly revisiting your data, asking the right questions and acting on insights ensures your website evolves in line with user needs and business priorities, not just what looks good on a dashboard.
Share this page
Related Topics